Credence Is A Phase, Not A Property
I was bugged by a question for a while - so what happens to credence goods, and especially healthcare, when AI appears? Do they remain credence or get de-credenced? What happened to credence goods over history - how did changes in underlying technology change them over time? And what I discovered is that almost all goods / products were credence once, and credence is not a fixed category. Studying history tells us where new technology creates most value and where it creates no value at all. Also, there’s an awful lot of detail you can infer by just looking at these graphs about any product - if consolidation through M&As makes sense, if vertical integration makes sense, and a lot more. I’ll try to only scratch the surface here!
What is a credence good?
So before that, for folks who don’t understand credence goods (skip to the next section if you know it already), here’s a story:
In 2011-12, three researchers (Janet Currie, Wanchuan Lin and Juanjuan Meng) trained 20 students to act as patients and sent them to doctors at 80 hospitals in a large Chinese city. Every “patient” presented the same case: a mild flu-like history, the kind antibiotics don’t help. They also asked the doctor for antibiotics, in two different versions: in one version they said they would buy the drugs at a drugstore themselves, and in the other they didn’t mention where the drugs would be filled. When the physician knew nothing about where it would be filled, they assumed a hospital purchase and prescribed an antibiotic 85% of the times, vs 14% of the times when they knew the patient would fill it elsewhere. For identical symptoms and the same request.
So, why does this happen? The textbook explains these phenomena by sorting goods into 3 categories: search, experience and credence goods. George Stigler was the first who positioned the cost of searching for information as an economic problem. Philip Nelson later separated search goods (important qualities one can inspect before buying), from experience goods (qualities one discovers by using these goods). Michael Darby and Edi Karni added a third category in 1973: credence qualities - things that remain difficult or costly to evaluate even after consumption. Surgery was an obvious example. So was automobile repair. Over time, “credence good” has acquired a slightly mystical meaning: something whose quality the buyer simply cannot know.
That is too strong. And the core issue with most explanations, LLM generated or otherwise (at least it was for me), is that they treat the entire thing as a discrete category rather than a spectrum.
A purchase is an uncertainty problem
To understand the spectrum, let’s look at a purchase. Stop looking at it as a product or a service and treat it as an uncertainty reduction problem. Every purchase hides a fact that decides whether your choice is right: which fare is cheapest, what your prescription is, whether the repair is needed, whether the borrower will repay. You can deal with that uncertainty in 3 ways: you can leave it unknown, find it out yourself, or have someone find it out and tell you. Each one has a cost:
- Stakes of not knowing (V) - what you expect to lose by choosing without knowing
- Cost of knowing yourself (C) - time, money, skill, tools
- Cost of asking a trusted advisor (T) - their fee, plus whatever their bias costs you
A buyer simply picks the cheapest of the three. That’s the whole model.
The phase diagram
So now if you plot these 3 variables (ignoring Pearson’s spurious correlation) in a 2D plane, with V/C on the x-axis and V/T on the y-axis, you come up with this map of where a good stands (I tried V-C and V-T as well, but this is nicer).
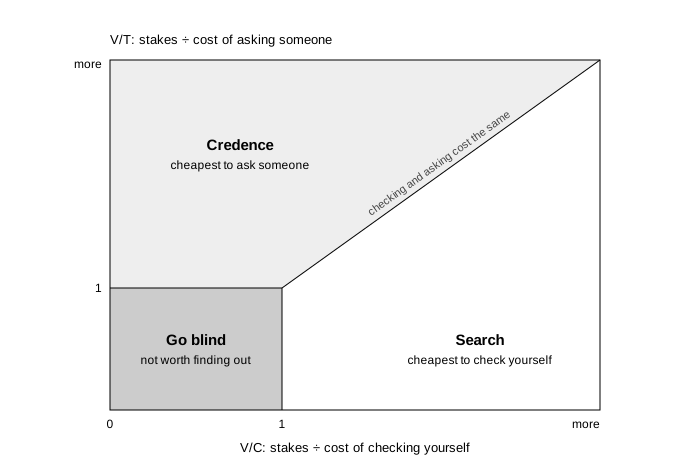
Figure 1. Each axis says how many times the stakes cover a cost. The further right, the cheaper it is to check yourself. The further up, the cheaper it is to ask someone.
Of the four quadrants, the bottom-left square is what you would call “go blind” goods: both checking and asking cost more than what’s at stake, so nobody bothers finding out. The top-left is what you would call credence goods: asking someone is cheaper than checking yourself. The bottom-right is what you would call search goods: checking yourself is cheapest. The top-right is where the diagonal decides - above it ask is cheaper and below the line it’s easier for them to check themselves. Experience goods sit high up on the credence side of the graph: trusting the seller is cheap, because you’ll find out after and won’t come back if they lied. As you can see it’s just a special case of credence good per se that way.
This is why I call it a phase diagram. Metallurgists use the iron-carbon phase diagram to tell which form steel takes at a given carbon content and temperature. Heat the same steel and it changes phase. Purchases work the same way. A good is not credence or search by nature. It sits in a phase for its current V, C and T, and when those change, the same good changes phase.
The same thing over time
Another way to look at the same dynamics is plotting them as a dollar amount on the Y axis and time on the X axis.
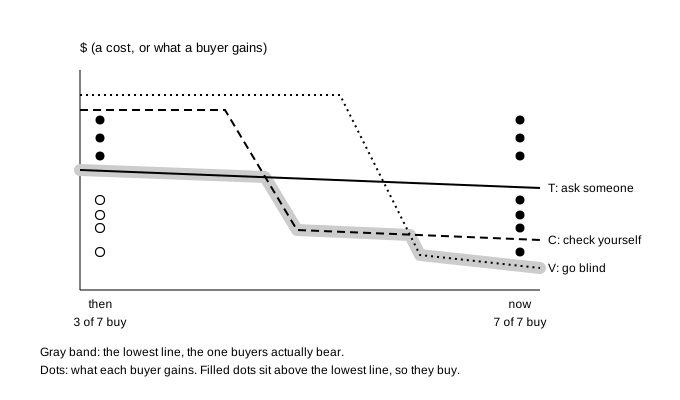
Figure 2. The three costs over time for a typical good (illustrative). Buyers bear whichever line is lowest.
We can see that most goods start where V is fairly high and so is C, so the cheapest is T. With time, as more and more trusted advisors appear, T lowers because of competition. With more usage, regulators or warranties, V goes down, and technology makes C go down. Depending on what goes down faster, the good moves from one phase to another, and the transaction volume keeps climbing as min(V, C, T) falls.
The reason is simple: a buyer goes ahead only when what they gain from the purchase is more than the lowest of the three lines. So the volume is the number of buyers whose gain sits above the bottom line.
What all can you infer from the graph?
(Won’t go into depth to spare unnecessary text, will leave it for you or your AI to infer.)
A. Only changes in the bottom-most line create disruptions. An innovation in lowering C wouldn’t move transaction volume if the stake is low and V is still the bottom line. Lines above the bottom can move all they want. The one exception is the second line: if whoever sells the cheapest route can set its price, they charge just under the next cheapest route, so the second line sets the price.
B. The biggest jumps come when a new line drops below the old bottom line. This would look like a phase change: buyers who were not buying at all show up. Lowering a line that is already the bottom helps too, but less. When online bookstores made obscure books findable, the value of that extra variety to buyers was 7 to 10 times the value of the lower prices (Brynjolfsson, Hu and Smith, 2003).
C. Getting bigger helps only where T is the bottom line. A brand is trust product, so a bigger, better-known name lowers T. This helps where T is already the bottom line or that it’s a credence good. Those are scenarios where consolidation under one brand makes sense: highway motel chains, or the Big Four auditors. Where C is the bottom line, the seller’s size doesn’t lower anything for the buyer. Consolidation then happens among whoever can do the checking: three credit bureaus, a couple of big booking sites.
D. Whoever pays the advisor decides the bias. If the advisor also sells the fix, or is paid by the seller, T hides a cost the buyer can’t see. That is the opening story: same doctors, same symptoms, and the prescription changed with who sold the drug. So owning both the advice and the sale (vertical integration) pays for the firm only while C stays above T. Once checking gets cheap, or a rule separates the two, it stops paying. Competition doesn’t fix this either. It lowers the advisor’s fee, and when the fee hits zero, the advisor gets paid by the seller instead: free comparison sites paid per click, zero-commission brokers paid by the firms that fill their orders.
How goods moved: stories from history
And this is the crux of the story: how different changes over time have moved V, C and T, and thus how a similar product has moved around different places on the phase diagram.
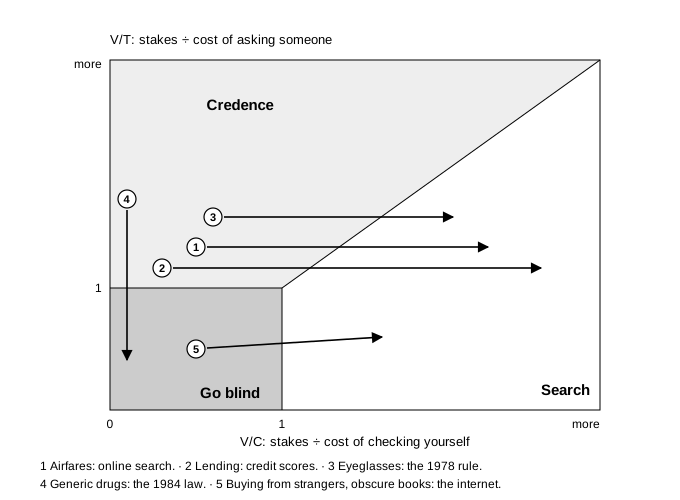
Figure 3. How the goods in the stories below moved across the phase diagram.
1. Travel agents
Until the 1990s, fares lived in airline computer systems that only travel agents could see. After US airline deregulation in 1978, fares changed all the time. Checking yourself meant calling several airlines, so C was high and people asked their agent. T was the bottom line, and airlines paid agents a commission on every ticket.
Then fares came online. For simple trips, C dropped below T and people started booking themselves. Airlines stopped paying base commissions around 2002, since nobody needed an agent to read fares anymore. Agents kept the complex trips, where C is still high. Fares moved from credence to search (arrow 1).
2. The bigger internet story: things people were not buying at all
The travel story is one line dropping below another. The bigger change was for things where V was the bottom line, and people simply didn’t buy. Buying a used item from a stranger in another city, or a book no nearby store stocked, was not worth the risk or the effort. eBay’s ratings and buyer protection, and Amazon’s catalog and reviews, dropped C and T below V. That created transactions that did not exist before (arrow 5), and that is where the largest gains were (corollary B).
3. Credit bureaus
Before credit scores, whether a borrower would repay was something only a local banker who knew them could judge. For any other lender C was high, so borrowers were stuck with their local bank. Credit bureaus collected payment histories, and in 1989 the FICO score turned them into one number any lender could check. C for lenders collapsed (arrow 2). Lenders far away could now compete, and the local banker stopped being the one who judged. The checking itself consolidated into three bureaus, which is corollary C: when C becomes the bottom line, consolidation moves to whoever does the checking.
4. Eyeglasses
Before 1978, the optometrist who tested your eyes also sold you the glasses, and many US states banned advertising glasses. You could not easily compare prices, so you trusted the optometrist, and glasses cost more where ads were banned (Benham, 1972). In 1978 the FTC made optometrists hand over the prescription. Nothing got cheaper to measure, but now you could take the prescription anywhere. C for the price of glasses dropped below T, and glasses moved from credence to search (arrow 3). Chains and later online sellers followed. This is corollary D: owning both the advice and the sale stopped paying once the buyer could check.
5. Generic drugs
Before 1984, you trusted the brand and your doctor that a pill worked. You could not check it yourself. The 1984 Hatch-Waxman law made it easy for generics to get approved once they showed they work the same as the brand. That didn’t make C or T lower. It made V lower: once the pills are certified the same, there is little to lose by not knowing which maker’s pill you got. Today about 9 in 10 US prescriptions are filled with generics, and most people never check which one they got. Generics moved to the go-blind corner, safely (arrow 4).
The usual story
For almost any new product or service, there’s usually a similar trajectory in terms of what’s the cheapest option: T first (someone you trust), then C (you check yourself once tools arrive), then V (options become the same and nobody needs to check). Some skip a step: generics went straight from asking to going blind. Some get stuck: a surgeon’s judgment in the operating room can’t be turned into a tool. Some go back: car maintenance moved from doing it yourself back to trusting a mechanic once cars became computers.
Which way a good moves depends on four questions:
- Can the fact (to reduce uncertainty) be turned into a standard reading that a tool can produce? Then C falls.
- Can advisors compete, and are they paid separately from the answer? Then T falls.
- Can sellers charge different buyers differently, or are the options different by nature? Then V stays high, and people keep checking or asking.
- Can a standard, a warranty or a redesign make the options the same? Then V falls, and people stop checking.
So what happens to healthcare when AI appears?
The internet mostly lowered C for facts that are the same for everyone: prices, listings, reviews. AI mostly lowers T for facts about you: your lab result, your symptoms, your bill. It also makes an expert cheaply available to anyone, so T also lowers for things that seemed to expensive so far. Where T lands decides what happens.
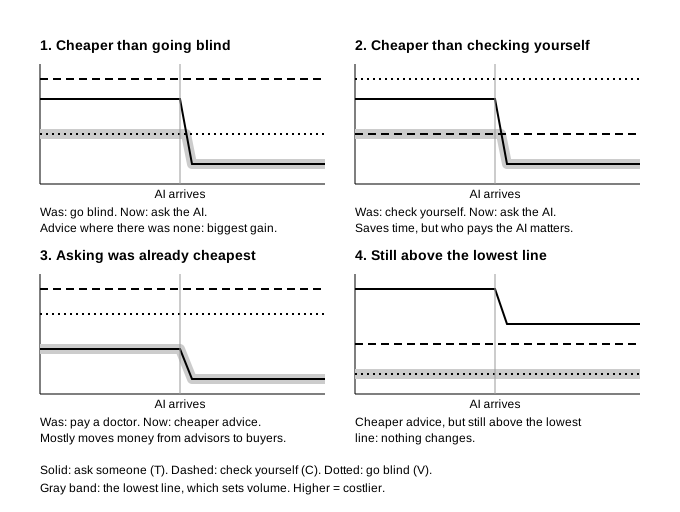
Figure 4. AI lowers T. What that does depends on which line was the bottom line before.
- Below V - people who used to go without advice now get it. This is the biggest value, like the internet’s new markets.
- Below C - people who used to research themselves now ask the AI. It saves time, but whoever pays the AI decides the bias (corollary D).
- Where T was already the bottom - people who already paid a doctor get cheaper advice. Money moves from doctors to patients, and licensing slows it down.
- Still above the bottom line - nothing happens (corollary A).
And healthcare is not one good. A doctor’s visit bundles several facts, and each sits in its own phase. Renewing a stable prescription is already just numbers, so T drops and it moves first - Utah is already piloting AI that renews routine prescriptions. Reading your own lab results or images moves toward C. The hands-on exam is stuck, since no tool reads it. And whether a treatment worked compared with the alternative can only be answered by trials or wearables, so it moves only when institutions move. And this is just the surface of the iceberg!